
Welcome! This is the first article in our series dedicated to website speed optimization. Ahead of you lies a breakdown of technical pitfalls and real-world cases, but we want to start with the main myth that has been stressing business owners for years.
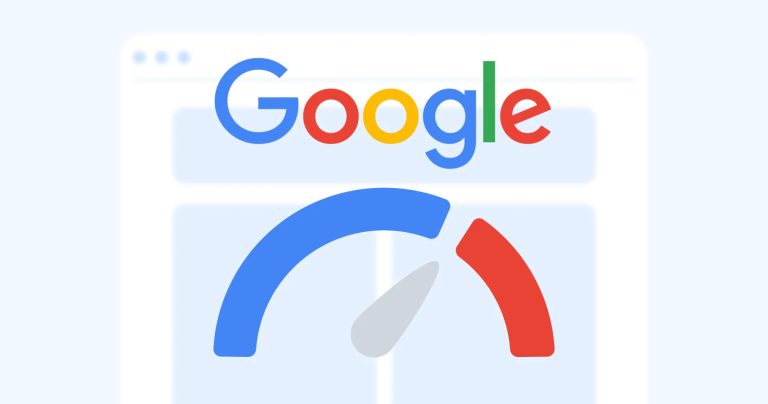
Remember this moment: you open Google PageSpeed Insights, see a worrying red or orange number (for example, 42), and panic begins. “Everything is broken, customers are leaving, we need maximum website speed, call the developers immediately!” Let’s understand why chasing a 95+ score is often a trap that costs thousands of dollars but brings no real business value and does not improve e-commerce SEO performance.
What data are you actually seeing in the interface?
When you run a test, Google PageSpeed Insights shows two different data blocks. The main interface trap is that the large circular score (for example, 68 “Performance”) represents only laboratory data (Lab Data). This is a simulated test generated by a program called Lighthouse.
The robot does not know the real loading speed your customers experience. It simply runs a test that simulates the worst-case scenario: an old smartphone on a slow 3G connection.
Field Data — the real user experience
To see reality, you need to look at another section above — Field Data. This reflects Core Web Vitals and real user experience over the past 28 days.
Where it comes from: every time real users visit your website via the Chrome browser (on mobile or desktop), the browser anonymously records how fast content loads and whether the interface feels responsive. Google aggregates millions of these real interactions into the CrUX report over the last 28 days.
Why Field Data is more important than Lab Data
The lab simulator evaluates your site in a “vacuum”. Field Data shows how your website performs in the hands of real users.
If your audience uses modern smartphones and fast 4G, your Field Data can be green and fast even if the lab test still shows low scores. Google uses this real-world data to decide whether to rank your site higher or not.
How Google calculates Core Web Vitals (75th percentile)
Google evaluates Field Data using the 75th percentile instead of a simple average. The logic is practical and very human.
Imagine 100 real users visiting your site. Most of them experience instant loading. But a few users access the site in an elevator with poor signal or on an old lagging phone.
If Google used an average, these few extreme cases would ruin your entire score and push your site into the red zone. Instead, Google sorts all users from fastest to slowest, removes the worst 25%, and evaluates the value at the 75th percentile.
Why this is NOT something to fear
Search engines are not asking for perfection. Your site won’t be downgraded just because it was slow for someone in a basement parking lot. You don’t need to be fast for absolutely everyone.
What this means for business
Your website should perform well for the majority (75%) of real users in normal conditions. If 75% of your audience has a good experience, Google considers your site healthy—even if lab tests are unhappy.
That’s why Google clearly states in its documentation: a high lab score (90+) does not guarantee a good real-user experience. Real user data matters far more than simulated results.
Why big e-commerce platforms don’t panic
To remove the fear completely, look at large e-commerce platforms. Complex enterprise systems often score only 30–35 in lab tests due to heavy architecture.
Yet leaders like:
- Ford
- Puma
- Rozetka
continue to perform successfully despite low PageSpeed scores.
Real-world data shows that the average product page load time in e-commerce on mobile is around 4.5 seconds. Trying to push complex systems into perfect Lighthouse scores often leads to wasted budget with no real user benefit.
What actually slows websites down?
Website speed optimization should be smart and focused on real user experience—not on pleasing a simulator. Often, owners install dozens of “quick fixes” that end up making things worse.
In the next article, we’ll explore:
“Free plugins that cost you money: the INP metric breakdown.”
We’ll show how 30 “free” plugins (chat widgets, popups, review tools) silently destroy Google’s INP metric (Interaction to Next Paint), freezing your customers’ phones when they try to click “Buy”.
Stay tuned—more insights are coming.


