

Welcome to the first article in our ecommerce website speed optimization series.
Over the coming weeks, we’ll be diving into real-world performance issues, technical bottlenecks, and practical online store speed optimization strategies. But before we get there, let’s tackle one of the biggest myths that continues to cause unnecessary stress for business owners, marketers, and ecommerce teams.
Picture this. You open Google PageSpeed Insights, run a test, and see a scary orange or red score staring back at you. Maybe it’s a 42. Maybe it’s a 58. Panic mode activated: “Our website is slow! Customers are leaving! We need a 95+ score immediately, call the developers!”
But here’s the question: Does a 95+ PageSpeed score actually improve your Google rankings? In many cases, the answer is no.
In fact, chasing a perfect Lighthouse score without a clear website performance optimization plan can easily cost thousands of dollars without generating additional organic traffic, conversions, or revenue.
Let’s look at why.
How to Read and Understand Google PageSpeed Insights Data
One of the biggest sources of confusion is that Google PageSpeed Insights shows two completely different types of data. Most people focus on the large score displayed in the circle.
For example: Performance Score: 68
That score comes from Lab Data, generated by a testing tool called Lighthouse. The problem? Lighthouse isn’t measuring how your actual customers experience your website.
Instead, it simulates a worst-case scenario:
- An older mobile device
- Limited processing power
- A throttled network connection
- Conditions similar to slow 3G
It’s essentially a robot running a stress test. Useful? Absolutely. The complete truth? Not even close.
The Data Google Actually Cares About
Above the Lab Data section, you’ll find something much more important: Field Data (Real User Data)
This is where Google measures your Core Web Vitals using real visitor interactions collected over the previous 28 days. Every time someone visits your website through Chrome—whether on mobile or desktop—the browser anonymously records performance information such as:
- How quickly content becomes visible
- How responsive the page feels
- Whether the interface freezes during interaction
Google aggregates millions of these real-world interactions into the Chrome User Experience Report (CrUX). This data reflects actual user experience, not a simulated test environment.
And that’s exactly why it matters.
Why Field Data is Crucial for Ecommerce SEO Rankings
Think about it this way.
A lab test evaluates your website inside a controlled environment. Field Data evaluates your website in the hands of real people. If most of your visitors use modern smartphones, reliable 4G or 5G connections, and current browsers, your website may provide an excellent experience—even if Lighthouse still reports a mediocre score.
That’s because Google ranking factors increasingly focus on real user experience.
Google wants to know:
- Does the page load quickly for actual visitors?
- Is the website responsive?
- Can users interact without delays?
- Does the experience feel smooth?
Those answers come from Core Web Vitals and Field Data—not from the number inside the Lighthouse circle.
How Google Calculates Core Web Vitals for Modern Websites
Here’s another detail many website owners don’t know.
Google doesn’t use a simple average when evaluating website performance. Instead, it uses the 75th percentile. Sounds complicated? It’s actually very practical.
Imagine 100 people visit your website. Most experience fast page load speed and smooth interactions.
A few visitors, however:
- Open the site in an elevator with poor reception
- Browse on an outdated smartphone
- Use unstable public Wi-Fi
- Have multiple apps consuming resources in the background
Naturally, their experience will be slower. If Google calculated a simple average, these extreme situations would negatively affect everyone’s results. Instead, Google sorts all user experiences from fastest to slowest and evaluates performance at the 75th percentile.
In simple terms: Your website needs to work well for the vast majority of users—not for every possible edge case.
Key Takeaway
Google doesn’t expect perfection. Your rankings won’t suffer because a handful of visitors had poor reception in an underground parking garage. What matters is delivering a consistently good experience for most users.
What This Means for Your Business
This is where many companies waste significant budgets on page speed optimization services. They become obsessed with improving a Lighthouse score from 88 to 95.
Meanwhile:
- Conversion rates stay the same
- Organic traffic doesn’t increase
- Revenue doesn’t change
- Customers don’t notice any difference
Why? Because users care about experience—not test scores. If at least 75% of your audience enjoys a fast, responsive website, Google generally considers your performance healthy.
This is why Google itself warns that: A good Lighthouse score does not automatically mean users are having a good experience. Real people matter more than simulated robots.
Why Large Ecommerce Brands Don’t Panic About PageSpeed Scores
Let’s look at reality. Some of the world’s largest ecommerce platforms operate incredibly complex websites with:
- Massive product catalogs
- Personalization systems
- Recommendation engines
- Analytics platforms
- Marketing integrations
- Third-party services
As a result, their mobile Lighthouse scores often sit far below the mythical 95+ target. Yet these companies continue to dominate search results and generate millions in online sales.
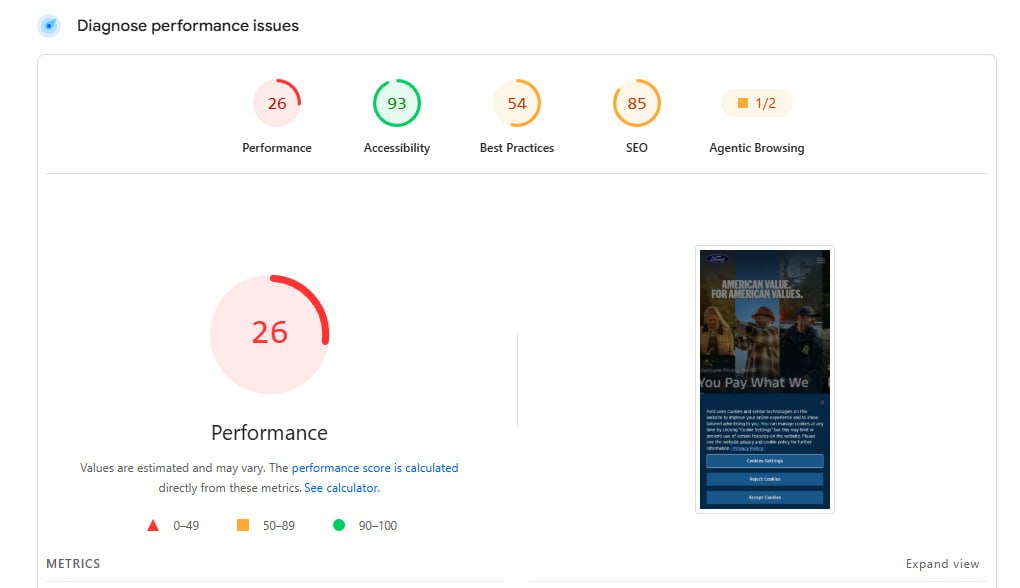
Consider a few examples:
- Ford manages thousands of products, vehicle parts, accessories, and service offerings through a large-scale ecommerce infrastructure built to support global operations.
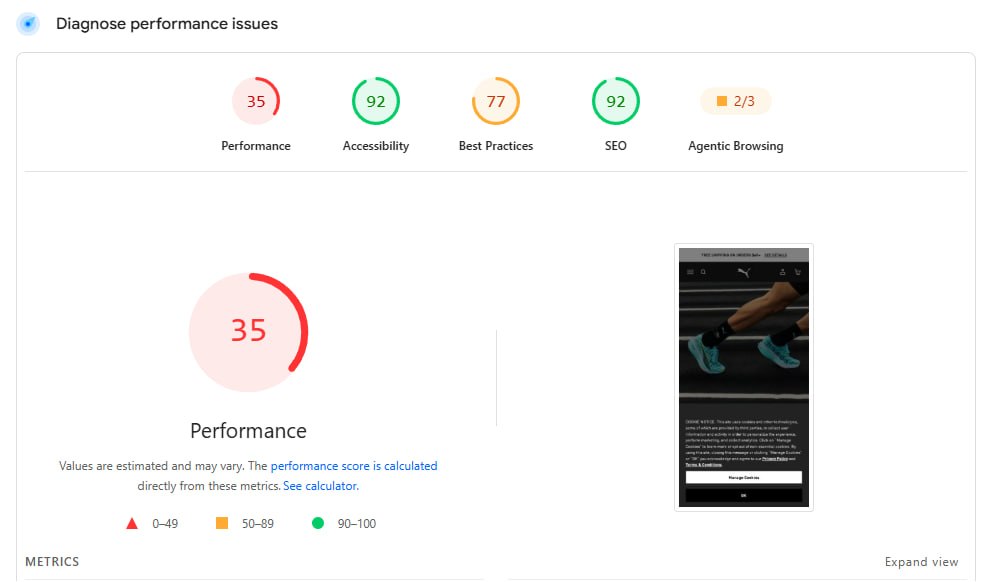
- Puma serves customers worldwide using sophisticated systems designed for international ecommerce, localization, inventory management, and high traffic volumes.
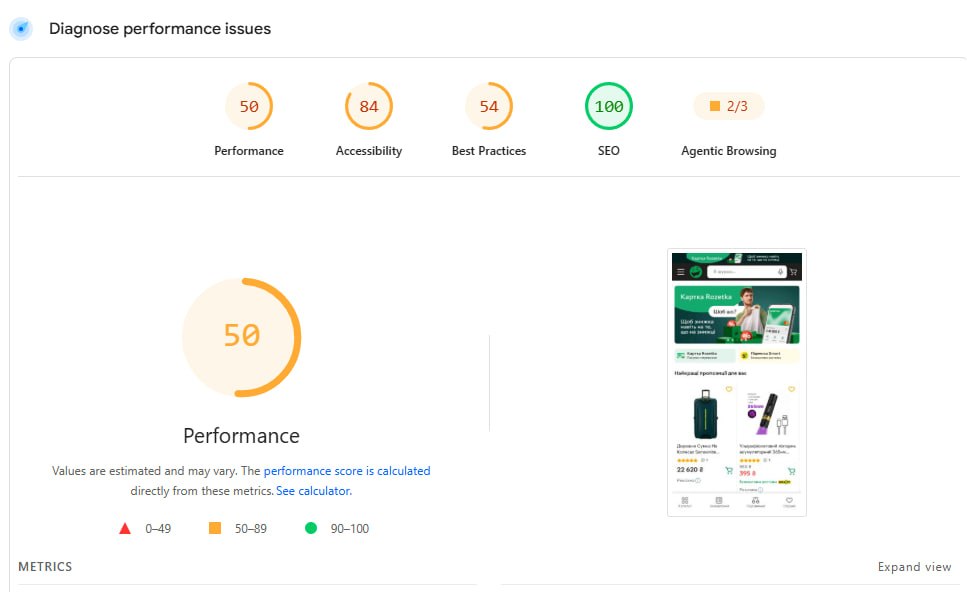
- Rozetka Ukraine’s largest ecommerce marketplace, operates enormous product catalogs, advertising systems, analytics platforms, and marketplace services that support millions of shoppers.
None of these businesses are losing sleep over achieving a perfect Lighthouse score.
Instead, they focus on:
- User experience
- Conversion optimization
- Revenue growth
- Website performance in real-world conditions
And that’s exactly what successful ecommerce SEO and speed optimization should focus on as well.
The Reality of Mobile Ecommerce Page Load Time Benchmarks
Industry benchmarks show that the average ecommerce product page load time on mobile devices is around 4.5 seconds. For complex ecommerce platforms, trying to force a perfect PageSpeed score often becomes an expensive exercise with little business value.
The customer rarely notices the difference. Your balance sheet definitely does.
Common Technical Issues: What’s Actually Slowing Down Your Website?
Here’s the real irony. Many businesses invest heavily in website optimization and accidentally make performance worse.
How? By installing dozens of “quick-fix” tools:
- Chat widgets
- Popup builders
- Review plugins
- Tracking scripts
- Marketing integrations
- Third-party extensions
Each one looks harmless. Together, they can quietly destroy website performance. And that’s exactly what we’ll cover in the next article.
Coming Next: The “Free” Plugins That Cost You Money
In our next post, we’ll break down Google’s INP metric (Interaction to Next Paint) and explain how dozens of “free” plugins can slow user interactions to a crawl.
You’ll learn why customers sometimes tap the “Buy Now” button and nothing seems to happen—and how hidden JavaScript overload is often the real culprit.
Stay tuned. We’re just getting started.


